

Analysis for December 2nd, 2013
EUR/USD
H4 chart of EUR/USD shows correction, which is indicated by Evening Star, Hanging Man, and Tweezers patterns. Closest Window is support level. Three Line Break chart and Heiken Ashi candlesticks confirm ascending movement.
H1 chart of EUR/USD shows correction, which is indicated by Tweezers pattern. Closest Window is support level. Three Line Break chart confirms descending movement; Heiken Ashi candlesticks indicates possible bullish pullback.

USD/JPY
H4 chart of USD/JPY also shows bullish tendency within ascending trend. Three Line Break chart and Heiken Ashi candlesticks confirm ascending movement; Engulfing Bearish pattern indicates possible bearish pullback.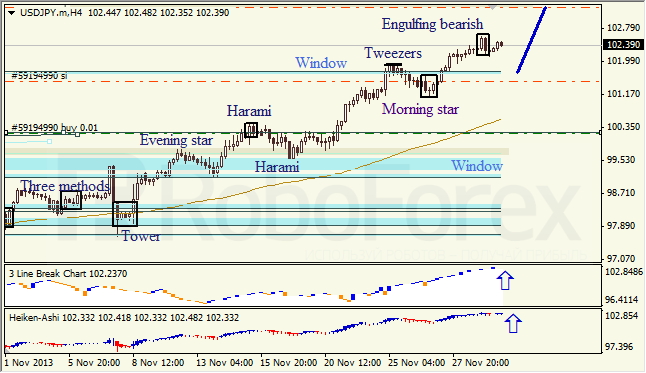
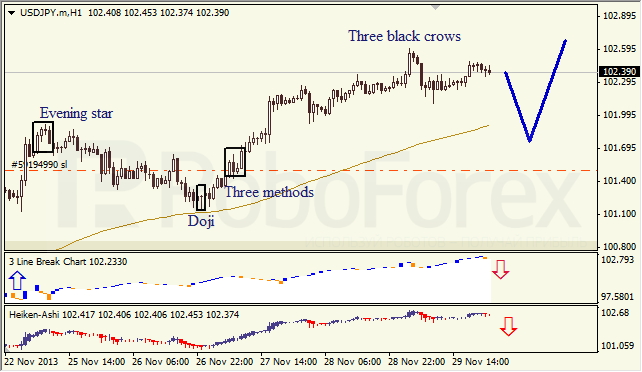
H1 chart of USD/JPY shows ascending trend, but Three Black Crows pattern indicates correction. Three Line Break chart and Heiken Ashi candlesticks confirm descending movement.
RoboForex Analytical Department
