

Forecast for December, 2013
EUR/USD
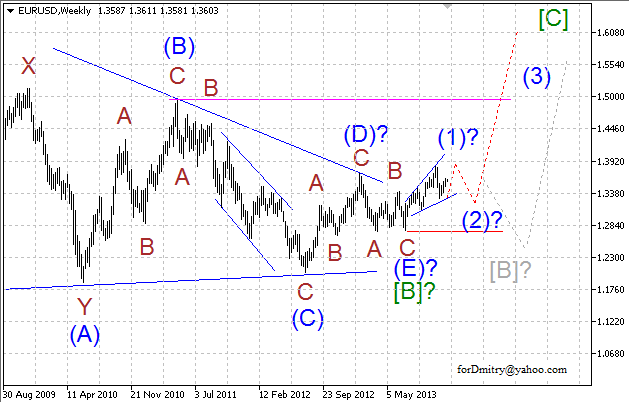
Most likely scenario at monthly chart implies that Euro is forming a large ascending zigzag [A] of [B] of [C] of z of (a) and by now may have already finished correction [B] of z in the form of horizontal triangle. However, this assumption has yet to be confirmed and pair may continue forming horizontal correction [B] of z for quite a long time.
One of the possible scenarios at weekly chart implies that Euro started possible ascending wave [C] withdiagonal triangle (1) of [C]. If this assumption is correct, then after completing diagonal triangle (1) of [C], price may start descending correction (2) of [C] and later continue moving inside up-trend and form wave (3) of [C].
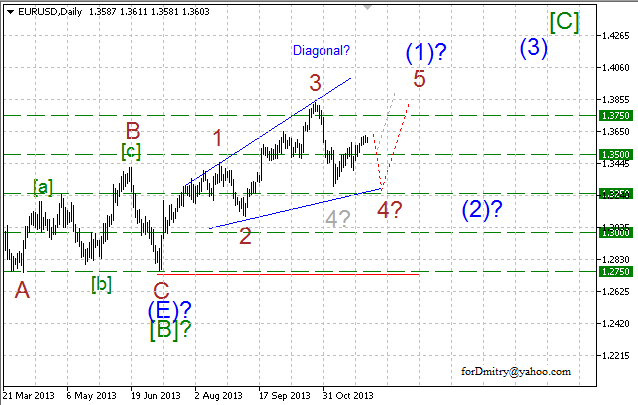
Possibly, price is forming ascending diagonal triangle (1) of [C] and descending correction 4 of (1) of [C], which may take the form of zigzag. In this case, after this correction, ascending trend may continue inside wave 5 of (1) of [C].
GBP/USD
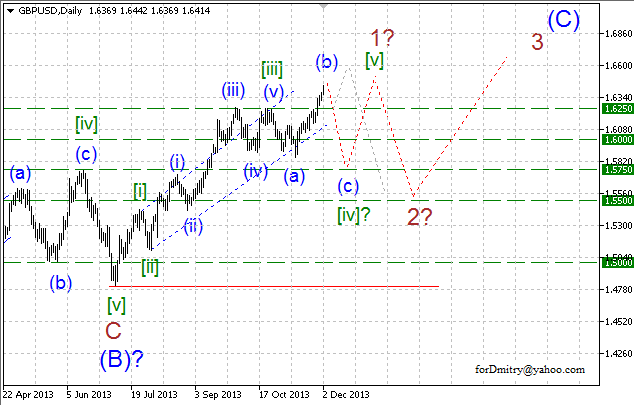
One of the possible scenarios implies that descending wave [A] of c of large zigzag с was completed, and right now pair is forming large ascending correction [B] of c, which may take the form of zigzag. If it’s true, then price is expected to start forming final ascending wave (C) of [B].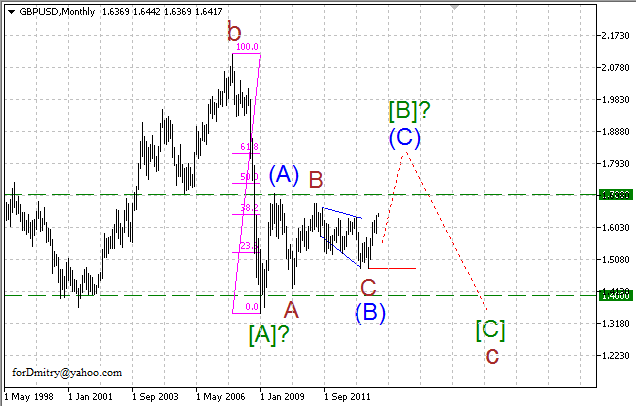
Probably, price started possible ascending impulse (C) of [B] with impulse 1 of (C), which is about to complete soon. In this case, after completing descending correction 2 of (C), ascending trend is expected to continue inside impulse 3 of (C).
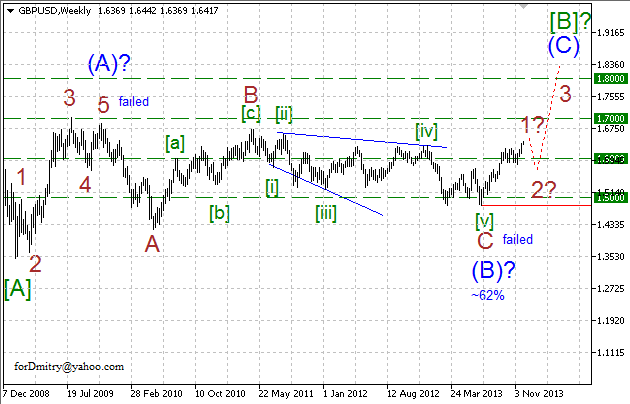
Probably, right now pair is finishing ascending impulse 1 of (C). In this case, price is expected to form descending correction [iv] of 1 of (C) to complete this whole impulse 1 of (C).
USD/CHF
Possibly, Swiss Franc is finishing global descending trend in the form of triple zigzag or descending wedge (a)with diagonal triangle [C] of z of (a). It may be confirmed by the fact that internal wave structure of thisdiagonal triangle looks completely formed.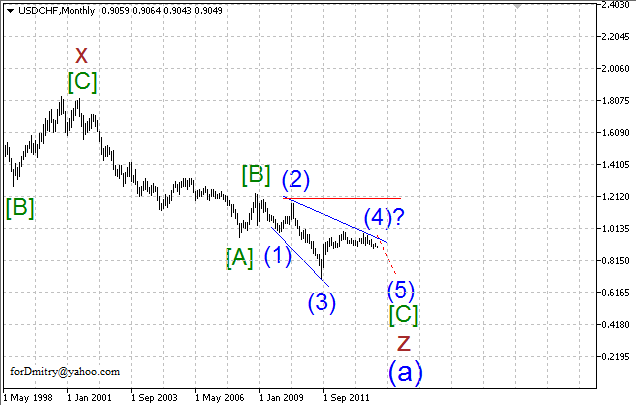
Possibly, price has already completed horizontal correction (4) of [C] and started forming final descendingzigzag (5) of [C], which may complete this whole global descending trend.
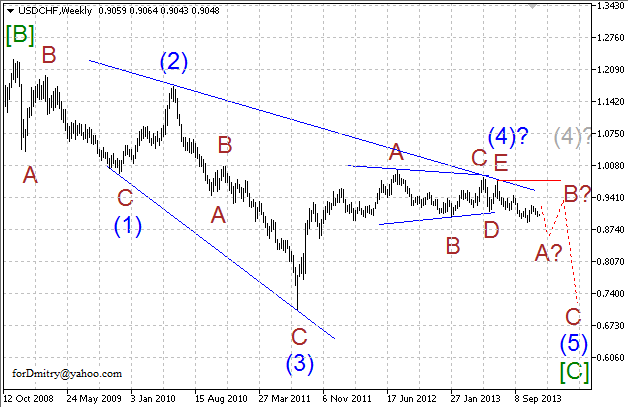
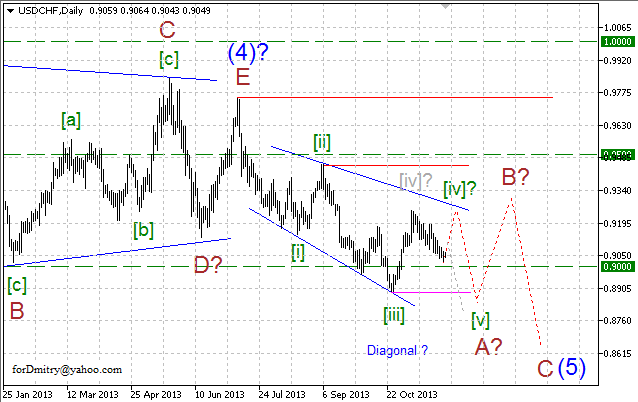
Possibly, the first wave A of (5) of descending zigzag (5) is taking the form or diagonal triangle and about to complete soon. If this assumption is correct, then after completing this descending diagonal triangle, pair may form ascending correction B of (5).
USD/JPY
One of the possible scenarios implies that pair is forming final descending diagonal triangle V of (a). Right now, price is forming its ascending correction [4] of V of (a) in the form of zigzag.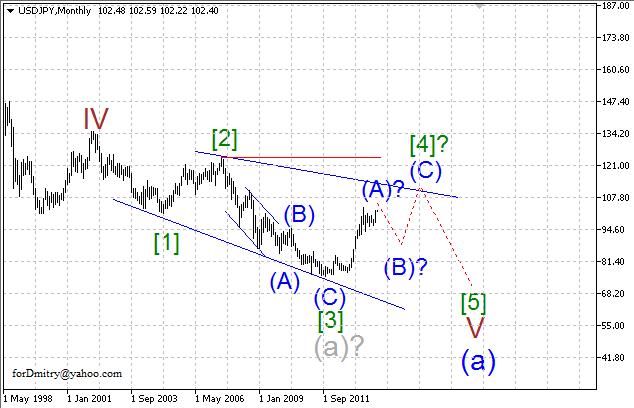
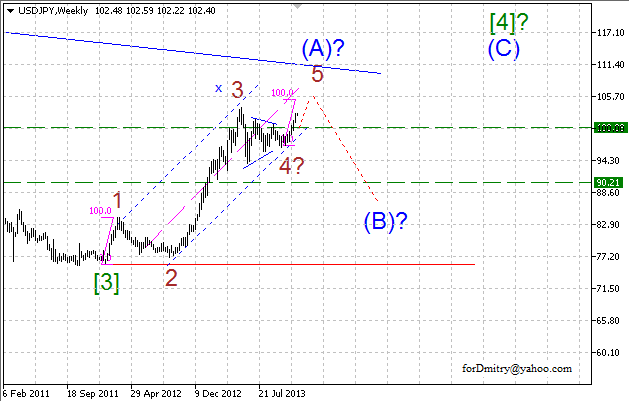
Probably, ascending correction [4] may take the form of zigzag; price is completing its first “leg” (A) of [4]in the form of impulse. In this case, after impulse (A), pair may start forming large descending correction (B) of [4].
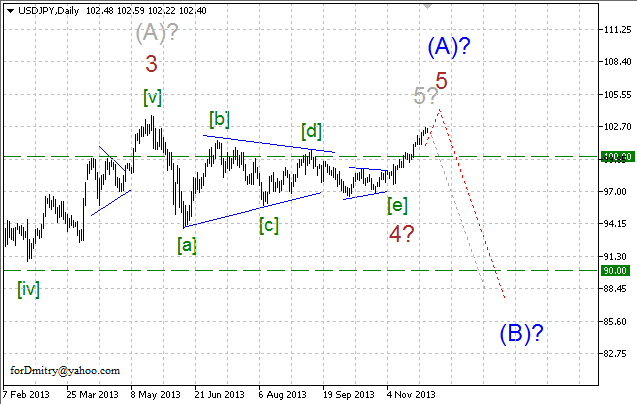
Probably, price is forming final ascending wave 5 of (A), which may complete impulse (A). If this assumption is correct, then later pair is expected to start forming large descending correction (B) of [4].
RoboForex Analytical Department
